Gruge now has one shared visitor chart across the website. Scroll below the page's content to find today's anonymous browser-session total, daily bars and the time of the latest update. The game keeps its own frame; the chart sits beneath it.
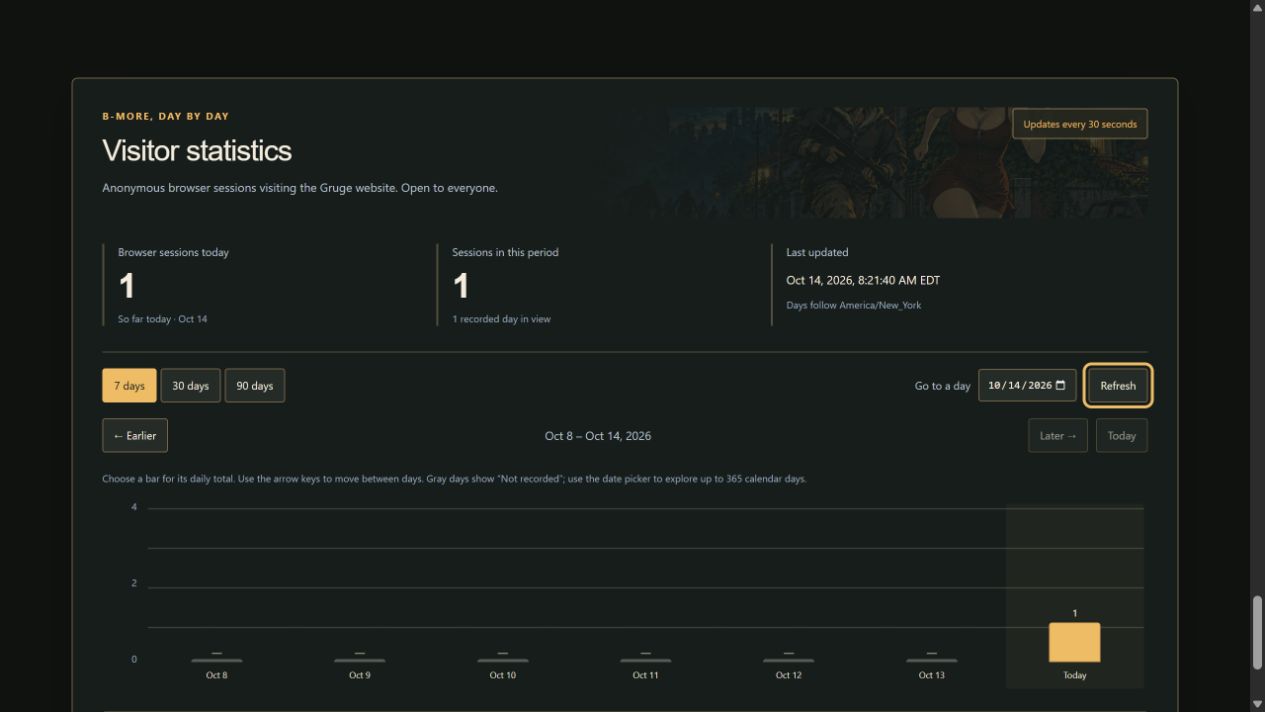
Choose a bar for that day's total. Switch between 7, 30 and 90 days, use the calendar to choose a date, or step earlier and later through the record. Today is marked as in progress. Visible pages refresh about every 30 seconds, and the Refresh button provides an immediate check.
The count follows America/New_York calendar days. An anonymous browser session is counted once that day across the entire site: refreshing, reading another article or moving into the game does not add another daily count. Returning on a later day counts again. These are browser sessions rather than unique people, and a period's total adds the individual daily counts together.
Up to 365 daily totals are retained. Days before tracking began are labeled “Not recorded,” and the first recorded day is partial. The chart does not invent an earlier history.
No account is needed. Only aggregate totals are public, and this counter does not store IP addresses or display visitor identities. Its anonymous cookie works across the site, while the count history stays in private server storage.
The same footer is included by the shared page generator, so future journal entries inherit it. On the game page, using chart controls pauses active gameplay and keeps date-navigation keys from steering either survivor. Return to the game and Resume when you're ready.
Play the current first mission , or watch the first promo before exploring the chart below.